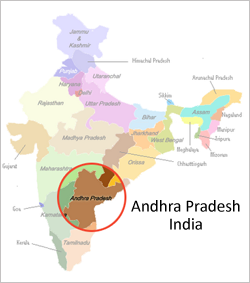
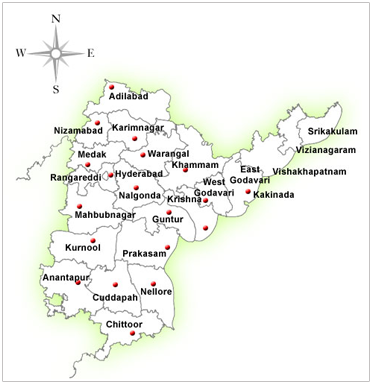
The demography, psychographic and techno graphic details of identified area including Skill Training Institutes, Job seekers, and Employers are studied on all the deployed regions.
As per census 2001, statistics of Andhra Pradesh is as follows:
| State:Andhra Pradesh | Male | Female | Total |
|---|---|---|---|
| Total Population* | 38,527,413 | 37,682,594 | 76,210,007 |
| Scheduled Castes | 6,228,011 | 6,111,485 | 12,339,496 |
| Scheduled Tribes | 2,548,295 | 2,475,809 | 5,024,104 |
| Workers** | 21,662,192 | 13,231,667 | 34,893,859 |
| Main Workers*** | 19,455,492 | 9,585,381 | 29,040,873 |
| Main Cultivators | 5,040,681 | 2,357,007 | 7,397,688 |
| Main Agricultural Laborers | 5,141,014 | 4,682,250 | 9,823,264 |
| Main Workers in Household Industries | 637,209 | 715,496 | 1,352,705 |
| Main Other Workers | 8,636,588 | 1,830,628 | 10,467,216 |
| Marginal Workers**** | 2,206,700 | 3,646,286 | 5,852,986 |
| Marginal Cultivators | 160,883 | 300,963 | 461,846 |
| Marginal Agricultural Laborers | 1,312,727 | 2,696,161 | 4,008,888 |
| Marginal Workers in Household Industries | 73,013 | 216,387 | 289,400 |
| Marginal Other Workers | 660,077 | 432,775 | 1,092,852 |
| Non Workers | 16,865,221 | 24,450,927 | 41,316,148 |
*Total Population Equal to Sum of Total Workers and Total Non Workers
** Total Workers Equal to Sum of Total Main Workers and Total Marginal Workers
***Total Main Workers Equal to Sum of Total Main (Cultivator + Agricultural Laborers + Workers in Household Industries + Other Workers)
****Total Marginal Workers Equal to Sum of Total Marginal (Cultivator + Agricultural Laborers + Workers in Household Industries + Other Workers)
The Main other workers(10,467,216) of the census records population plus the employed/unemployed, skilled/unskilled youth population are the community NaukriSMS target to intervene and create an impact in their livelihood.